Dec 23, 2013

BoT, BoX or BoH (BW-on-HANA)

Question: What does Radio VOE (Voice of Experience) recommend about migrating  SAP-BW to
[1] Teradata;
[2] Exadata/Exalytics; or
[3] HANA
 
View  1: Attributes for customers with SAP applications as source system for 50%+ of critical data
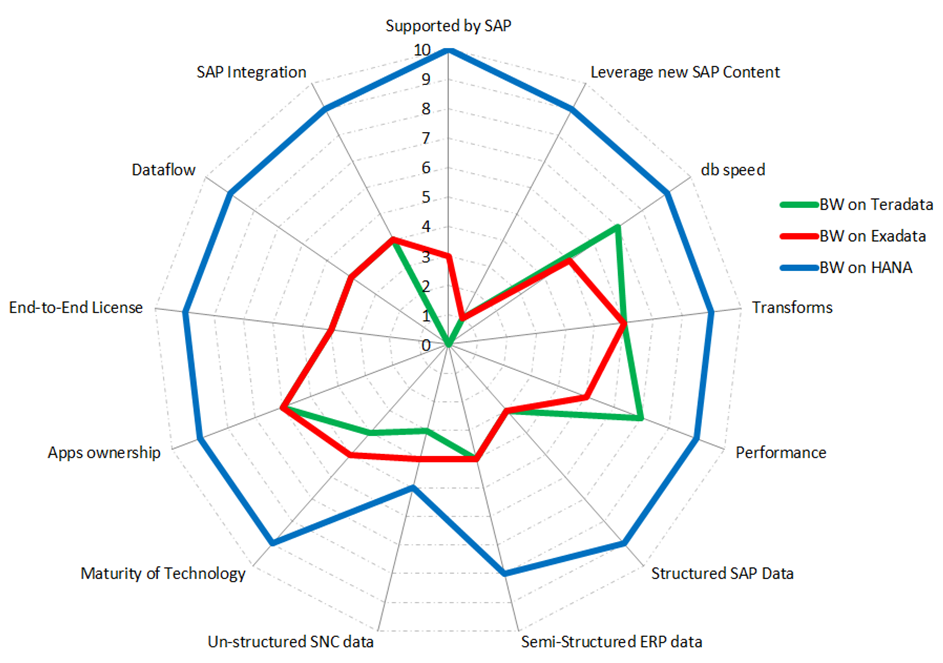


View  2: Same information different visual


1.        BW-on-Teradata (BoT)

In the early 2000’s SAP partnered with Teradata as an alternative database for BW. To cut the story short globally there is currently only one customer with BW on Teradata and probably will always remain as the only customer to have ever taken a very short trip on a BoT (BW on Teradata). You don’t want to go there or ever take this path.. end of story
So that should lay to rest any endeavor for a BoT migration
PS the customer is currently seriously considering migrating their BoT to BoH in 2013..

2.       BoX (BW-on-Exadata) vs. BoH (BW-on-HANA):-

F     For BW-on-Exadata the foundational advice would be similar to the one for BW-on-TD. If 99% of the planet is going on one path don't try to reinvent another one on your own. There is inherent safety in numbers. Radio VOE has validated that the strategic advantage of following the herd far outweighs the adventurist assumptions & costs of being a loner, ie. Having the rare honor out being the 1:5000 implementations on a unique track does carry its own risks and disadvantages. The key decision is not only about tactical cost but about strategic Business Value.
       Keep this as your 'center-of-the-universe' decision factor of your final decision.


Attributes

BoX (BW on Exadata)

BoH (BW-on-HANA)

What it really is

Database

Business Application platform

What you get with BoH

Database

Business Application Platform

Over 300 RDS solutions

Automated Database slimming applications

Predictive analytics platform

Prescriptive analytics capabilities

What you get with SoH

Database

Over 900 prebuilt views for real-time operational views

Prebuilt Operational analytics that come free with SoH

Access to state-of-art analytics and informatics

Predictive analytics platform and algorithms

Pricing

Will need Exadata Plus Exalytics, Plus

A license for every non PRD system including DR

Data base license, Plus Analytics engine

OLAP engine

Calculation engines and other applications

Check the total and final cost of ownership

All in one HANA platform and one price for PRD HANA. All other systems in the landscape come free


What type of db is this

RDBMS

In Memory, Columnar

Master Node RAM availability

NA

1TB currently, 4 TB by Q2 of ’14 and 8-12TB by Q4 of ‘14

Similarities

Exadata is an appliance

BW on HANA is an appliance

ACID compliance

NA

Fully Compliant

Need for MOLAP, Aggregates, Caches

Yes

No

Very High Strength

Structured data - Oracle ERP

No seamless SAP integration

No seamless comprehension to SAP  config changes

Structured Data- integration to SAP Applications

100% seamless integration to SAP Master and transactional configurations

Seamless merging of multiple master data and source system deviances – on the fly in memory mergers


Medium Strength

Seamless

Seamless Integration to semi Structured data

Weakness

Unstructured pure Big Data

Unstructured pure Big Data

Partnered with Hadoop providers & Hadoop startups

Competition

Box compete with Teradata

HANA has no apparent competition for SAP customers.

No of Customers

NA

2400+ to date

Additional Needs

Will need Exalytics to provide accelerated queries

Does not need any additional accelerators

HW selection

Only from Oracle

Monopoly in HW development, support and services. No competitive forces encouraged.

Multiple global HW partners approved by SAP . This leads to customer advantage as it leverages automatic market driven  competitiveness and development between HW partners

Who are the top 2 HW leaders

Oracle, Oracle and Oracle

HP is currently reported to be in the leadership position for HANA appliance installations followed by IBM


Strategic Impact

Does not align with SAP Suites strategy

Aligns to the HANA One-database strategy where customers get actual gains of HANA. Zero latency between OLTP and OLAP

How does it transform

Disc to server and back.

Data is passed from server to server till results are compiled. There is a need to break up responses

Database

All the calculations are done in memory in the db itself

No need to break up responses

How does it perform

Slower than Teradata

Oracle Benchmark: 10 bill records <10 o:p="" secs="">

Fastest on the planet

My experience 45 billion records < 1sec

SAP Benchmark- 240 billion records < 1sec


Maturity of the technology


Is equivalent to BW Accelerator


Undisputed global leader


How does it work

1.  Database server to

2.  Compute server to

3.  Storage cells to Exadata cells

All in-memory

Data Loading

1.        ETL files in DBFS

2.        Oracle golden Gate

3.        Streams

4.        3rd Party

1.        Data integration tools

2.        SLT (Real-time from ECC

3.        BODS for batch loads

4.        DXC direct BW

License

Every system in the landscape is subject to a license

1.        DEV, Test, QA, and PROD

2.        HA, RD and Training

3.        Other, i.e. Projects landscape

Only PROD is licensed

All other systems and Free (not licensed)

What you get

Traditional DB accelerator

1.        Traditional ‘Wait & Debate’ engine

2.        Database

3.        Transaction Engine

Everything else supposedly are separate tools and licenses

Breakthrough HANA Platoform

1.        Real-time ‘Business NOW’ engine

2.        Database

3.        Transaction Engine

4.        Dimensional Engine

5.        Analytics Engine

6.        Predictive Engine

7.        Text Engine


Modeling methodology

Traditional- 10+ steps

ODS> ETL> DW> caching> Indexing> Aggregates> Query> Calculation Engine> Query Transforms> RESULTS

Breakthrough 3-steps

DSO> In-Memory Analytics> RESULTS

Impact of modeling method

·         Latency between operational and decision data

·         Infrastructure intensive

·         Expensive by system resources

·         Creates duplicates and is slow

Up to 1,000 times faster

No indexing or aggregates

Calculation / Transformation methodology

Traditional:

·         Most at OLAP (Query) layer – extremely inefficient

·         Rest in DW layer                    - Very Inefficient

Breakthrough calculation

·         Direct database transformations

·         Real-time db calculations

·         No mid-tier bottlenecks

Data-Center Impacts

·         Typically RAC (extra Costs)

·         Storage uses ASM failure groups

·         Box is a single point of failure

·         DR is a full license

Uses MPP automatic failover

Disaster recovery

·         License: full license for HCC, and even remote mirroring

·         2nd Exadata server/ non-Exadata server

·         Decompression to standard Oracle server possible with considerable performance loss

License: No extra Charge

Provided by HANA vendors


For SAP customers


All new functionalities only being developed on HANA

1.        BW seamless upgrade & migration in one step

2.        Over 900 views for ECC

3.        New RDS for CRM

4.        New RDS for SCM

5.        Industry specific solutions


Oct 13, 2013

Escape Velocity for BW-on-HANA Projects


AUTHOR'S NOTE: Escape velocity (Ve) is the speed at which the kinetic energy + the gravitational force on an object is zero. Any speed above that will allow the object to break free from the gravitational pull of the larger mass. Ve is a combination of  G= gravitational pull; M=mass of the larger object; and r = distance from the center of gravity. Ve is used to launch rockets free from the gravitational constraints of planets, and it can also be used to leverage the gravitational mass as a slingshot -  where the gravitational pull of large bodies can actually be used as a slingshot for acceleration and escape. This is written as  

In our context the global desire is to escape from the dark pull of failure. Let’s call this the black-hole of failure.

Ve= Escape Velocity in BI projects (including SAP HANA BI) can thus be defined as

Where

F is the pull towards failure as a constant (where the rate of failure is constantly balanced by the rate of success thus a point of accepted tolerance by business stakeholders and users). F can be more clearly understood where if a team delivers 5 successful reports (defined as reports that meet business expectations) and at the same time deliver 5 reports that do not meet business expectations- but are not punished by the system, governance or the business owners as a failure team the 0.5 is the balancing constant. Now if the team produces 4 successful and 6 not successful deliverables which begins a gravitational pull that is negative, or a pull that can crash either the developer of the team towards the black-hole of failure then a corrective action has to be taken at all points below 0.5. In our example if the team delivers 10 out of 10 reports that do not meet business expectations it assumes the developer or team reaches a 0 velocity and falls straight into the black-hole of failure never to emerge again. This is a perpendicular fall to oblivion.
P represents the propensity towards failure. This represents the negative mass of your black-hole, i.e. the pull of failure. P represents the place you don’t want to go. P also represents the failure probability with specific standards, processes and methodologies. P is often predictable when viewed through a scientific lens. For example if you have standards and processes that constantly deliver a 50% failure rate,  then your P factor has to be large whichever way you look at it.

n represents the center of negative gravity of the  dark planet and the lowest point of no return. At this point the trajectory of the developer and/or team has no recourse to getting additional budgets, additional chances or any recourse for another try. At this point managers are fired, partners are fired and individuals are fired. Of course in our example it is not the end of existence as the teams are simply replaced by another partner, manager and team – mostly in desperation, at far lower budgets, in very unplanned projects and with a lot of (n) negative pressure. 

I tend to be hyper-attracted to two Gartner findings on global BI.

Gartner in 2003 – “50% of BI projects will not meet business expectations”
Translation: There is a very high probability that 50% of reports in your production environment are either not being used or will never be used by your business users.

Your takeaway: As you rush ahead at full speed understand that what got you here (i.e. a design that constantly delivers a 50% failure rate) should not be used to take you to the strategic HANA future

Your decision:
1.    Continue with the current standards and processes
2.    Continue with your current architects and modelers
3.    Continue with your current System Integrators

.. and reach the same point of failure where you currently exist only after deploying a net new acceleration technology

Gartner in 2013 – “70% of BI projects will not meet business expectations”
Translation: In the 2012-14 period more and more customer are treating new technologies as Technical installations. While global spend on BI has gone up their propensity to failure has also increased. The current rate of failure is over 70%, from a 50% in the 2003-09 periods.

Your takeaway:
[1] HANA is a business solution and not a technology installation, what is the benefit of accelerating a 70 second query to 1 second if business will never use it
[2] There are many scientific ways to reduce the cost of your HANA migration anywhere from 20 to 60%

Gartner’s 2013 advice for big data projects “This is a time of accelerating change,  where your current IT architecture will be rendered obsolete,” Mr. Sondergaard, Gartner Sr. Analyst, said.  “You must lead through this change, selectively destroy low impact systems, and aggressively change your IT cost structure.  This is the New World of the (big-data), the next age of computing.”

Your decision:
1.    Find out how to leverage the scientific options of the IQDCT HANA methodology. Increase Quality, Decrease Cost and Time
2.    Build net-new global HANA standards and processes and then seriously consider moving greenfield to BoH (BW-on-HANA)
3.    Build net-new global HANA FEDW (Gartner architecture) and leverage automated HANA modeling
4.    Consider changing your current System architects, design planners and even your SI, i.e. there is adequate data that proves that existing folks will only follow existing / familiar paths. If you leverage existing resources then they will take you only on a predictable path, i.e. 70% failure. If this were not true then they should have taken you on a path of Escape Velocity way before you read this paper.
5.    Consider merging your many BW system on a global FEDW architecture. Benefit 100% central governance, with 100% local independence. Ability to detach a business unit for this environment over a weekend without disrupting any other central or local business unit.

.. and reach the same point of failure where you currently exist only after deploying a net new acceleration technology


 Leveling the playing field: It has been clearly established that successful BI projects experience a higher acceleration that is directly related to the degree of success. Acceleration here is measured by satisfied business users, lower spend per project, fewer unplanned projects, happier stakeholders that view BI as an investment, easier budgetary allocations and a high degree of trust – competency of the IT team to deliver results.

On the other hand it is similarly established that failed BI projects experience a drastic slowdown proportional to their degree of failure. Deceleration here is measured by more dissatisfied users, higher budgetary allocations due to trying to fix failed deliveries, higher number of unplanned projects due to lack of meeting business expectations, disappointed stakeholders that start to view BI as an expense, difficulty in getting new budgets approved due to a total lack of confidence in the team to deliver any business results – lack of business confidence in the delivery team.

Examples of F in existing BI environments are totally measurable. Take an inventory of every report in your production BI environment. Drop them to an excel sheet. Separate them by Business function, i.e. FI, OTC, P2P, SCM, etc. Place all the FI reports into one worksheet, OTC into another and so on. Create three columns [1] Can use as is- do not change; [2] Can use but needs change; [3] cannot use please delete. For each report that can be used as-is score a +1; for each report that needs change score 0; for each report that cannot be used score a -1. Then come and post your score on this URL for a global BI Score of F. Enter your email if you want results shared. No company or individual details will ever be share and your input will be in strict confidence.

Examples of F in new BI projects, i.e. not yet live, are also measurable. Take an inventory of every report that your SI partner plans to deliver. Apply the same rules as above and get your users to fill the three columns as above. In this case most of your users will not be able to accurately score the individual reports but you will still get a trend that will be highly beneficial. You will find out quite early what your probable F factor is. Once you go live conduct the same exercise around 30-60 days after go live, as by this time your users will understand the usability of each report and its direct business benefit or lack of it thereof. Compare the two and we once again get very interesting results.

Examples of P in existing projects is scientifically predictable. Your partner’s P score determines the speed at which your partner will pull your HANA BI project towards failure. The pull is a a gravitational pull based on the mass of defective procedures and methodologies that come with a partner. It is the combined score of their recommendations and methodologies. If your partner recommends a HANA installation as a technical installation then score them -3, and so on and so forth. If your partner simply delivers what the client asks them without any scientific inputs or forecasts then socre them -4, i.e. when a pharmaceutical company asked a leading SI to simply replicate 100% their 1998 Cognos reports on to the new HANA plus BusinessObjects 4.0 platform. This was as much the fault of the customer in firstly demanding legacy reports and for the partner in simply accepting a P factor with a very high mass, i.e. the probability of absolute failure was extremely large. In order to get your own propensity score, i.e. the propensity of your current SI, or their recommendations, request your P questionnaire and get your own propensity mass of your black-hole. The bigger the propensity mass the faster this black-hole will pull your strategic success towards failure, the faster you need to travel towards success as your escape velocity.

Examples of n in existing projects is scientifically predictable. In our above example of Cognos the SI ended up providing over 6 months of services in a fixed bid contract – total loss. Even after 6 months the customer had to cancel the project as the very foundations of the project were erroneous. The pull of the large mass of failure was disproportionally large and at a certain point all parties know that Ve could not be achieved. Could this have been predicted – absolutely right before the project had even started.

In yet another example a SI went and delivered over 500 reports. Within 20-30 days the business users realized that the deliverables were not going to meet their expectations, by day 40 businesses reverted to their old reports and stopped using the new BI environment. By day 50 our team was invited with a single statement ‘How can you help get business confidence back in BI’. Upon analysis we found that the methodology, standards, processes and resources were all wrong- so the next project started with a total replacement and rebuild of the BI environment but one-step-at-a-time. Success went from 12%, i.e. 88% failure, to 92% user satisfaction in a matter of 4 months.

So understand Ve, work towards it and measure if your trajectory can release you from the mass of failure and launch you to your goal of success.

In this example the impact of, or resistance caused by, bad decisions of managers and/or inexperienced resources is not taken into consideration even though it has a profound impact on the total Ve of BI projects.
In addition Escape Velocity is a misnomer as it is not any particular velocity but a relative speed that is dependent on the distance from n, or the negative mass of failure. The farther away from P that we are the lesser speed we need to apply to attain Ve, at a certain distance from failure one can remain perpetually free from the negative gravitational pull of P.

Quantifying the HANA BI Escape Velocity

By simple scientific rules
n: is the point of damnation and the center of the mass of failure. It is also the absolute point of no return. No amount of budgets or efforts can make the project escape failure.
The Red circle is the point of escape. The lower your project flies the more energy (budgets, resources and efforts) the project will require to simply remain afloat. The degree of failure (Gartner says this is 50% to 70% right now) determines the point of location on the E1 axis.
The Green circle is the point of survival or equilibrium, at which point the gains are fully sustained with minimal efforts. This is the point launch to Ve. The degree of survival is determined by the point of location between the surface and the green circle represented by E2
E3 is the point of escape velocity, where with a minimal effort BI projects can soar to high degree of success, very low wastage and minimal efforts to attain high gains.

What’s on your roadmap… can you see past the horizon or do you never look beyond your feet..